Cues in mass flowering of Dipterocarpaceae
Graphical Data Exploration
Before performing any statistical analysis, it is important to thoroughly understand the nature of the data. In order to do that, various graphical tools were explored. Figures below summarize the nature of the data that I am using for this analysis for the four regions (East Borneo, West Borneo, East Peninsular Malaysia, and West Peninsular Malaysia). East Borneo (EB) region also contains a site in the Philippines and West Peninsular Malaysia (WPM) region contains sites from Sumatra, Indonesia.
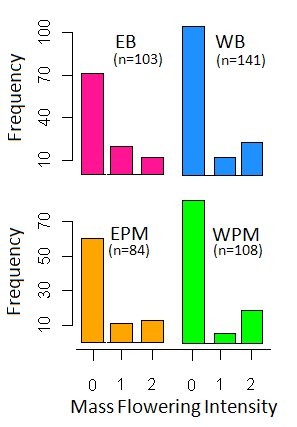
Figure 4: Frequency of mass flowering events.
Figure 4 to the left shows distribution of flowering data for the four regions. We can see that the flowering data follows a Weibull distribution. This is expected since mass flowering has 15-30% chance of occurrence (see Table 1 in the Introduction section). We can see that most of the observations happen when no flowering takes place. This also means that it isn’t possible to perform any parametric tests on this data as it is not normally distributed.
In Figure 5, I explored the occurrence of flowering at different sites for the four regions. The line graphs in figure 5 shows flowering intensity (y axis) and the year of occurrence (x axis) for each of the sites studied. We can see there is some overlap between flowering events at different sites. However, there are also a lot of discrepancies. This suggests that mass flowering is more locally synchronized then on a large spatial scale. Also, it suggests that flowering may depend on localized cues.
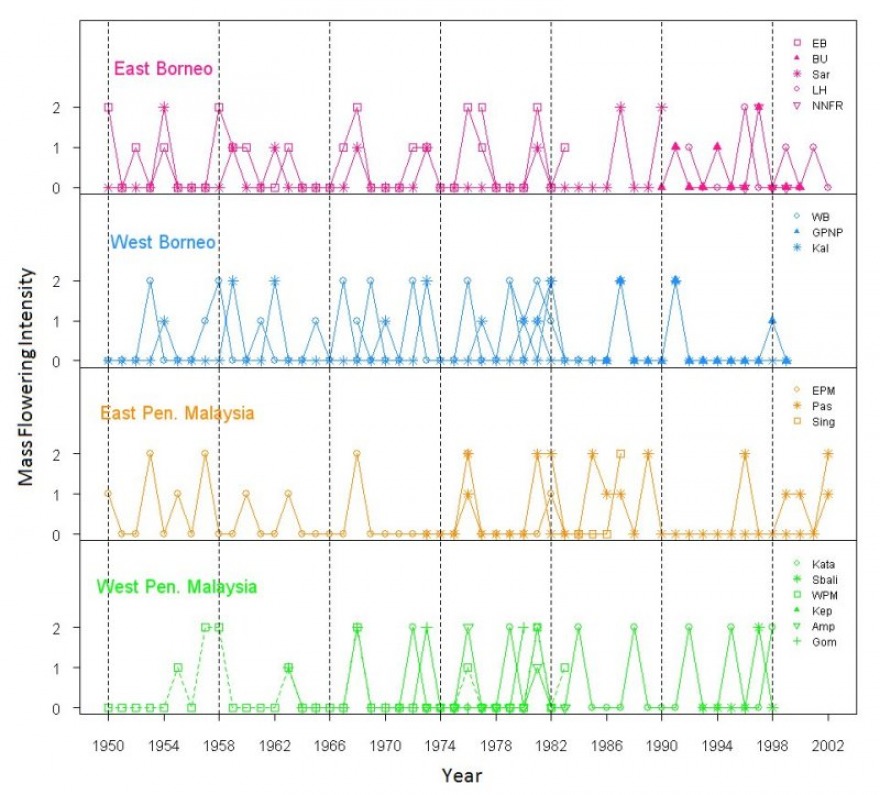
Figure 5: Mass flowering events trendlines by sites.
In Figure 6, I explored the weather and El Niño variables. Figure 6 shows boxplots for the weather and SST Anomaly 4 (an El Niño indicator) for each of the regions and also sub-grouped by flowering intensity. Firstly, we can see that mostly the data follows a normal distribution with the majority of the observation around the mean. We can notice some trends from this figure. First, we can see that East Borneo and the Philippines seem to be a little bit colder on average than Malaysia and Sumatra regions. Also, Borneo regions seem to be wetter on average than Malaysia regions. For the El Niño indicator, there is no regional difference as it’s a global phenomenon.
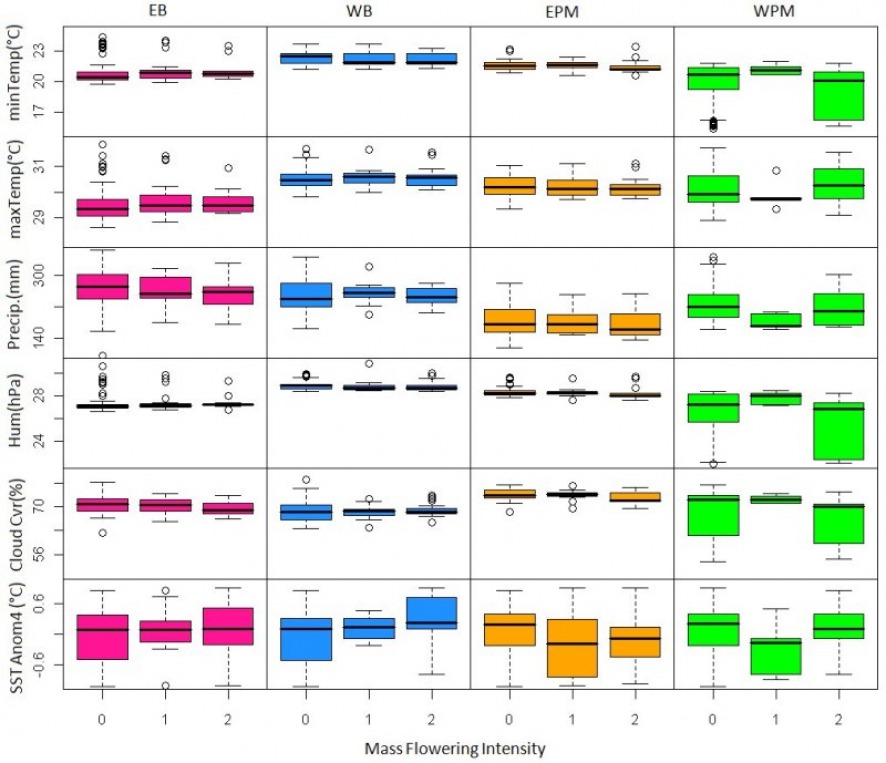
Figure 6: Boxplot of weather and El Niño variable (only SST Annomaly 4 shown here).
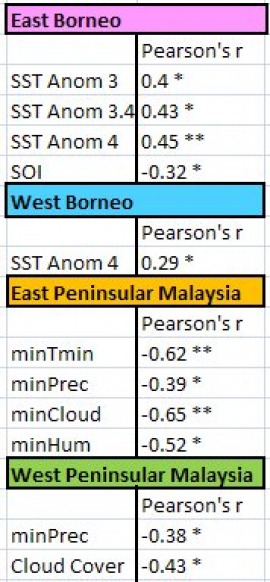
Table 4: Correlation analysis of weather
and flowering data. (* significant at p<0.1,
** significant at p<0.05)
and flowering data. (* significant at p<0.1,
** significant at p<0.05)
Table 4 explores correlations of weather and El Niño indicators with flowering. The table here shows only significant correlations found as a result of this analysis. Generally, we can see that El Niño has a strong correlation with flowering in Borneo and the Philippines. For Malaysia and Sumatra, we see that drought and drop in temperature has a correlation with flowering.
From data exploration I expect to see different factors having an effect on flowering in different regions of Southeast Asia.
From data exploration I expect to see different factors having an effect on flowering in different regions of Southeast Asia.
