Cues in mass flowering of Dipterocarpaceae
Clustering the sites into regions based on weather using NMDS, Cluster Analysis, and PCA
I performed a cluster analysis of the study sites based on weather normals in the study area. The purpose was to simplify later analysis by combining several sites into similar regions which exhibit similar weather and flowering trends.
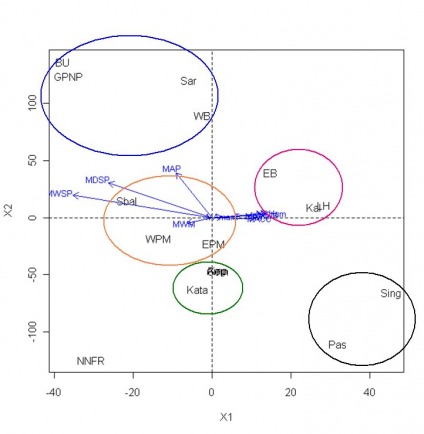
Figure 12. NMDS of study sites based on weather normals.
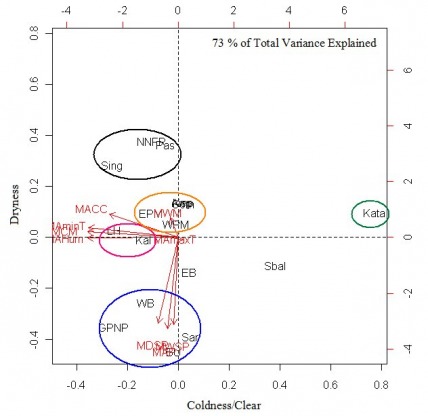
Figure 14. PCA biplot of Component 1 (coldness/clear) and Component 2 (Dryness) of weather trends in the study sites with red arrows indicating climate normals correlations with components.
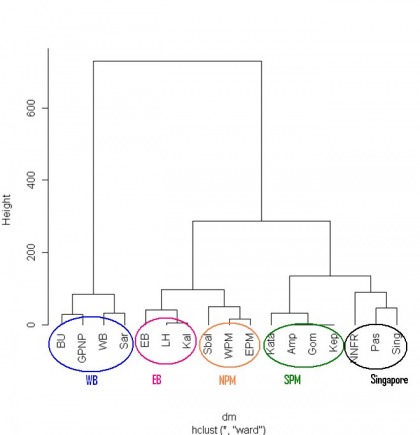
Figure 13. Cluster Analysis of study sites based on weather normals
The cluster analysis and NMDS of climate normals for the regions gives out almost the same results (figures 12 & 13). The sites clustered based on weather in five separate regions: East Borneo (EB – pink), West Borneo (WB – blue), Singapore (SING – black), South Peninsular Malaysia (SPN – green), and Northern Peninsular Malaysia (NPM – orange). One site, NNFR, which is located in the Philippines, is actually being clustered together with the Singapore region. However because of it's location, I put it together with East Bornoe.
PCA clustered the sites a little different (Figure 14). This is possibly due to the fact that the biplot shows only two components and explains 73 % of the total variation where as in NMDS and Cluster analysis all of the data is used in the analysis. In general, this suggests that based on weather trends, the regions are different. In this case we can also expect that phenology of these regions might be affected by slightly different triggers.
Clustering of sites base on phenology data using Cluster Analysis
The cluster analysis was performed based on phenology at different sites. Only sites with significant overlap of flowering data were used (at least 10 years). Figure 10 corresponds to sites of phenology data overlap from 1950 to 1983 and figure 11 shows sites that contained phenology data from 1973 to 1983. We can see from these two cluster diagrams that flowering patterns do not follow regional weather trends. There are some sites that cluster well regionally such as the West Peninsular Malaysia sites (Amp, Kep, Pas, WPM). Others are a bit more random. This suggests that weather may be only one factor in the trigger of mass flowering. Based on the phenology clustering I don’t expect to find high correlations and significance with weather cues.
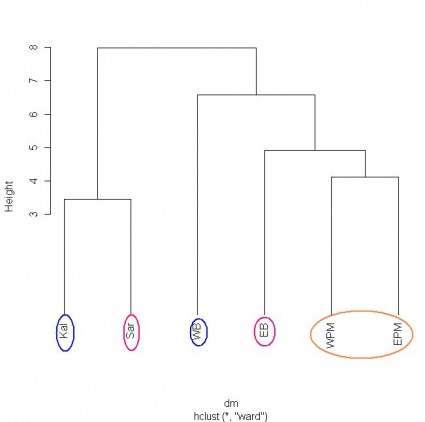
Figure 15. Cluster of sites based on phenology
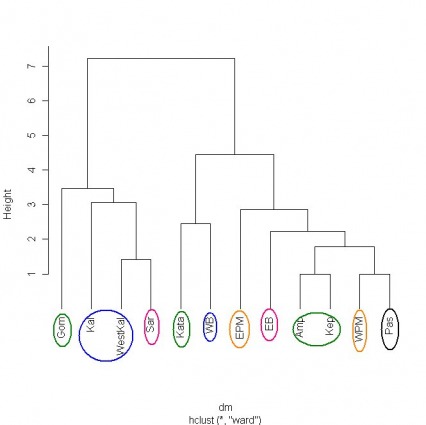
Figure 16. Cluster of sites based on phenology
Figure 17 below shows the spatial pattern that resulted after cluster and NMDS analyses was performed on sites based on the weather data.
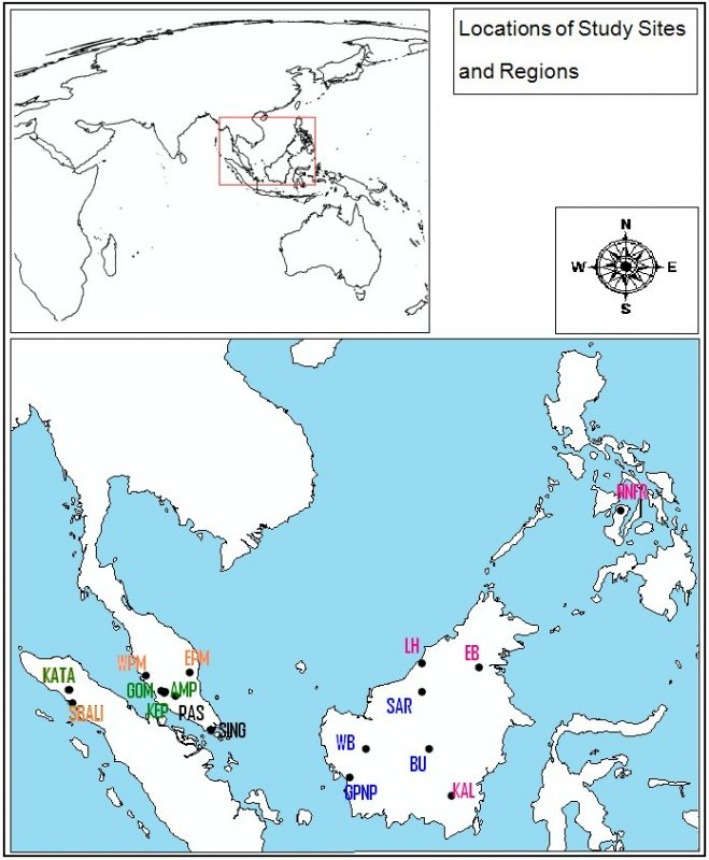
Figure 12. Map showing the clustering of sites into regions based on the cluster and NMDS analysis results
