Cues in mass flowering of Dipterocarpaceae
PCA with weather normals for Southeast Asia
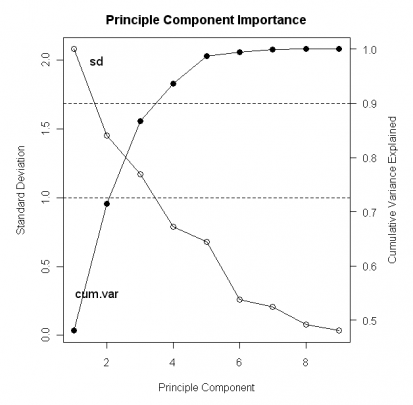
Figure 7. Standard deviation and cumulative variance explained of principle components for weather trends in SE Asia.
In order to explore the weather patterns in my study area, I performed a Principle Component Analysis on several weather normals for the period of 1950-2002. The variables used are mean annual minimum temperature (MAminT °C), mean annual maximum temperature (MAmaxT °C), mean annual warmest month (MWM °C), mean annual coldest month (MCM °C), mean annual cloud cover (MACC %), mean annual vapor pressure (MAHum hPa), mean annual precipitation (MAP mm), mean wet season precipitation (MWSP mm), and mean dry season precipitation (MDSP mm). PCA formed new components. Figure 7 shows the importance of these components by plotting cumulative variance explained and standard deviation of each. The first three explain 87% of total variance in the data set. The components were mapped using Arc GIS to develop a spatial trend. The first component (figure 8) has a strong negative correlation with temperature measures and humidity. The component plots the cold/warm gradient throughout the study area. Component 2 (figure 9) has a strong negative correlation with precipitation measures. Therefore it plots the dryness gradient of the region.
The third component (figure 10) has a strong positive correlation with cloud cover and a negative correlation with high temperatures. Overall, we can see that colder places are also wetter and more clouded, although the trend is not in perfect sync. We can also see that Borneo is a bit wetter and colder then the rest of the regions.
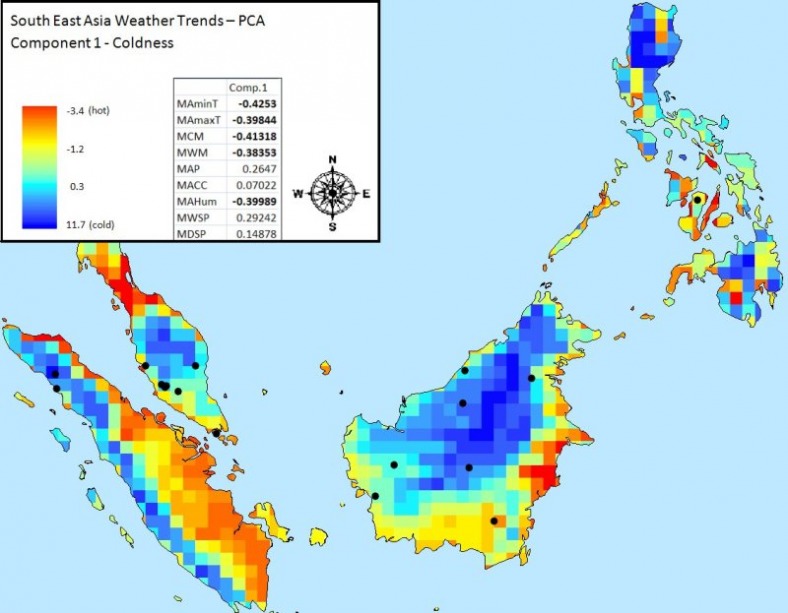
Figure 8. PCA Component 1 representing coldness and low humidity trend in SE Asia.
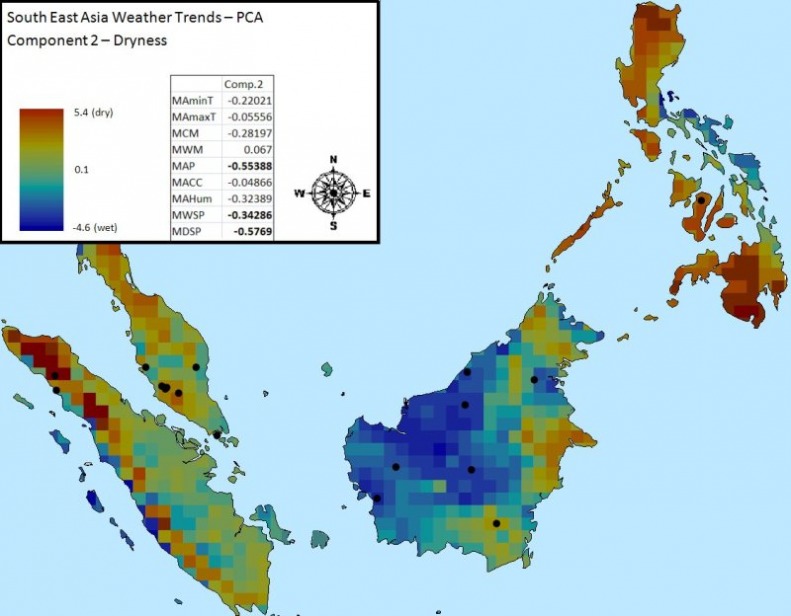
Figure 9. PCA Component 2 representing a dryness trend over SE Asia
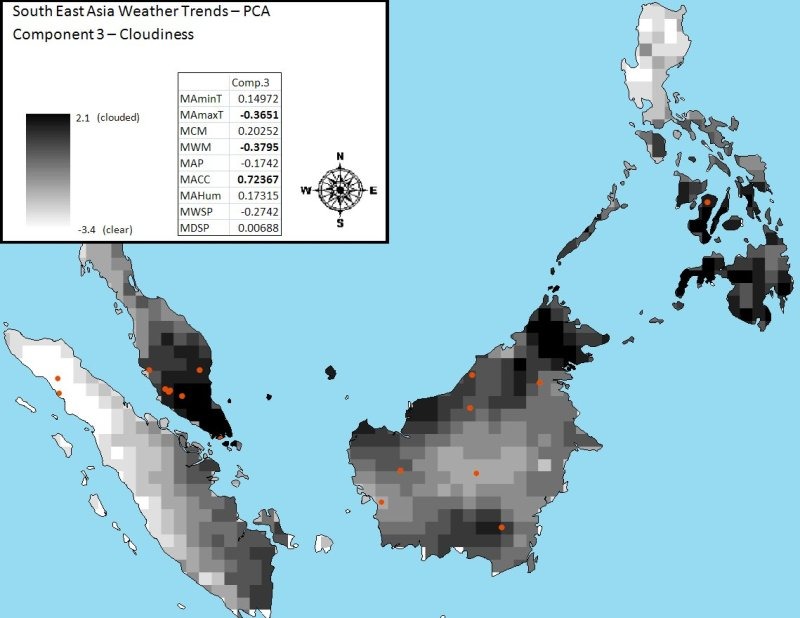
Figure 10. PCA Component 3 representing clearness and coldness over SE Asia.
El Niño impact on climate in Southeast Asia - Pearson's Correlation Analysis
I explored the relationships with climate variables and El Niño in my study area. El Niño indicators cannot themselves be the cues for mass flowering in Southeast Asia as they are global in nature. However, El Niño phenomenon has an impact on weather patterns all over the world and in Southeast Asia. It has been known to increase the intensity of drought in the region. The impact that El Niño has on weather can, however, vary. In order to explore these impacts, a correlation analysis was performed for monthly weather data at all the locations through out Southeast Asia and El Niño indicators for the period from 1950 to 1997. Correlation values were plotted using ArcMap GIS. Figures 11 shows correlation coefficients for El Niño and precipitation only, but other weather variables were analyzed with similar patterns forming. El Niño impact on climate is very regional in Southeast Asia. It is strongest on South Philippines and East Borneo. The impact is weaker in West Borneo. There is almost no correlation of El Niño and climate in Malaysia, Sumatra and Northern Philippines. According to this analysis, it is more evident why there is a correlation with El Niño and flowering in Borneo and in Malaysia there is none. It seems that El Niño impacts the weather in Borneo in such a way that causes mass flowering to occur.
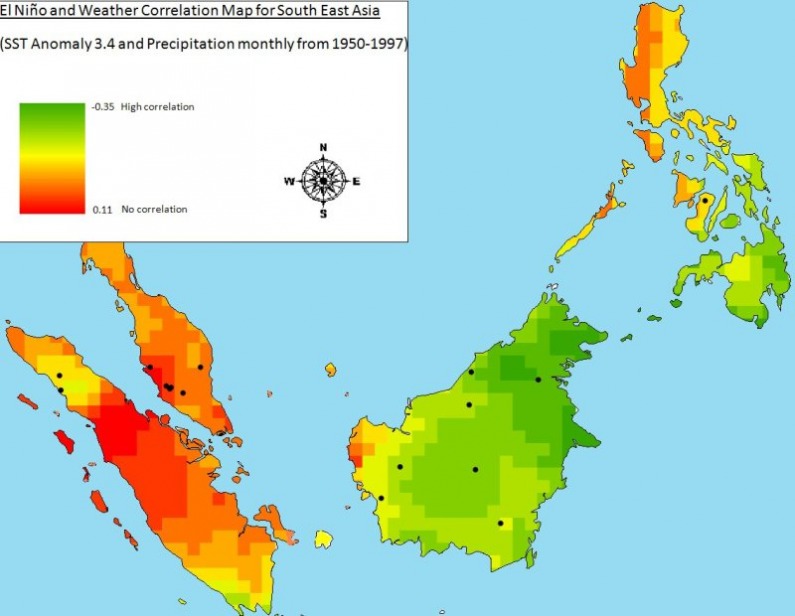
Figure 11. Correlation of El Niño (Sea surface temperature anomaly 3.4) and weather (precipitation) in SE Asia.
